TStorage – Benchmarking
The page presents a benchmarking analysis of various databases designed for efficient time series processing. As part of the benchmark, we compare.
- TStorage
- InfluxDBv1
- TimescaleDB
The benchmark aims to compare the write and read performance of different databases. The data source is a simulation of server workloads in data center environments. The metrics analyzed include various CPU parameters. This test is based on tasks derived from a widely used, publicly available benchmarking suite for time series databases—TSBS (Time Series Benchmark Suite), specifically the “cpu-only” scenario. More information about this test can be found here: https://github.com/timescale/tsbs

Benchmarking Hardware
Each test was performed on the same hardware:
- hard drive with operating system: 2TB HDD, SATA 6Gb/s, 512n, 7,200 RPM, 3.5-inch
- hard drives dedicated to the database and record source: 4TB HDD, SATA 6Gb/s, 512n, 7,200 RPM, 3.5-inch
- memory: 8 modules of 16GB RDIMM, 5600 MT/s
- processor: Intel Xeon Silver 4514Y, 2 GHz, 16 cores / 32 threads, 16 GT/s, 30 MB cache, Turbo, Hyper-Threading, 150W, DDR5-4400 support
- network card: Broadcom 57504 Quad-Port 10/25 GbE, SFP28, OCP 3.0 NIC
Database Preparation for Benchmarking:
In each case, the test was run locally, using one disk for the operating system and test execution, one disk for storing test data, and one dedicated exclusively to the tested database. If the database utilized additional logging mechanisms, it was permitted to generate logs on the operating system disk. The file system used was XFS for the test data and database disks, and ext4 for the operating system disk. The operating system was Debian 12.

TimescaleDB:
To prepare the TimescaleDB database, we follow the official installation guide for the latest version, available here: https://docs.timescale.com/self-hosted/latest/install/installation-linux/
The TimescaleDB configuration was modified so that the folders containing the ingested data were located on a separate disk, and the database owner was set to the user “tstorage.” To ensure that the running instance complies with the recommendations of the TimescaleDB developers, the timescaledb-tune tool was additionally executed to optimize configuration parameters accordingly.
Test Procedure
The test begins with the preparation of input data in a format compatible with the ingestion mechanisms of the respective database. The data, once ready for transmission, is then compressed using the gzip utility.
Input data for TimescaleDB and InfluxDB is generated using scripts provided by the TSBS benchmark. The same pseudorandom seed value is used for each data generation process to ensure result consistency. Detailed data description:
- pseudorandom number generator seed = 123
- data range – 2 years (2016-01-01 00:00:00 to 2018-01-01 00:00:00)
- number of metrics (counters) – 30,000
- interval between consecutive measurements – 5 minutes
- number of distinct values per measurement – 10
- measurement value format – integer.
For TStorage, the input data is prepared by converting the TimescaleDB data format into a format compatible with the reference TStorage client, using a dedicated conversion script
In addition to the described numerical values, TSBS generators also produce additional metadata related to the measurements. This metadata is ignored when inserting records into TStorage, as it is not used during the test. As a time-series database, TStorage does not store redundant metadata associated with records.
Client-Ready Data Format
InfluxDB Database
cpu,hostname=host_0,region=eu-central-1,datacenter=eu-central-1a,rack=6,os=Ubuntu15.10,arch=x86,team=SF,service=19,service_version=1,service_environment=test usage_user=58i,usage_system=2i,usage_idle=24i,usage_nice=61i,usage_iowait=22i,usage_irq=63i,usage_softirq=6i,usage_steal=44i,usage_guest=80i,usage_guest_nice=38i 1451606400000000000
cpu,hostname=host_1,region=us-west-1,datacenter=us-west-1a,rack=41,os=Ubuntu15.10,arch=x64,team=NYC,service=9,service_version=1,service_environment=staging usage_user=84i,usage_system=11i,usage_idle=53i,usage_nice=87i,usage_iowait=29i,usage_irq=20i,usage_softirq=54i,usage_steal=77i,usage_guest=53i,usage_guest_nice=74i 1451606400000000000
cpu,hostname=host_2,region=sa-east-1,datacenter=sa-east-1a,rack=89,os=Ubuntu16.04LTS,arch=x86,team=LON,service=13,service_version=0,service_environment=staging usage_user=29i,usage_system=48i,usage_idle=5i,usage_nice=63i,usage_iowait=17i,usage_irq=52i,usage_softirq=60i,usage_steal=49i,usage_guest=93i,usage_guest_nice=1i 1451606400000000000
TimescaleDB Database
tags,hostname string,region string,datacenter string,rack string,os string,arch string,team string,service string,service_version string,service_environment string
cpu,usage_user,usage_system,usage_idle,usage_nice,usage_iowait,usage_irq,usage_softirq,usage_steal,usage_guest,usage_guest_nice
tags,hostname=host_0,region=eu-central-1,datacenter=eu-central-1a,rack=6,os=Ubuntu15.10,arch=x86,team=SF,service=19,service_version=1,service_environment=test
cpu,1451606400000000000,58,2,24,61,22,63,6,44,80,38
TStorage Database
The CID value was set to the host ID from the corresponding hostname column. Both MID and MOID were set to 0, as each host generates only one record every 5 minutes.
0 0 0 473299200000000000 0x0000003a00000002000000180000003d000000160000003f000000060000002c0000005000000026
1 0 0 473299200000000000 0x000000540000000b00000035000000570000001d00000014000000360000004d000000350000004a
2 0 0 473299200000000000 0x0000001d00000030000000050000003f00000011000000340000003c000000310000005d00000001
3 0 0 473299200000000000 0x0000000800000015000000590000004e0000001e0000005100000021000000180000001800000052
4 0 0 473299200000000000 0x000000020000001a0000004000000006000000260000001400000047000000130000002800000036
5 0 0 473299200000000000 0x0000004c000000280000003f0000000700000051000000140000001d00000037000000140000000f
Writing Records
- we clear the contents of the data storage disk to ensure identical starting conditions
- we start (or launch) the tested database
- we start the timing measurement using the system tool "time"
- we run the data-writing script (tools provided by TSBS for TimescaleDB and InfluxDB; a custom tool for inserting data into TStorage)
- we stop the timing measurement
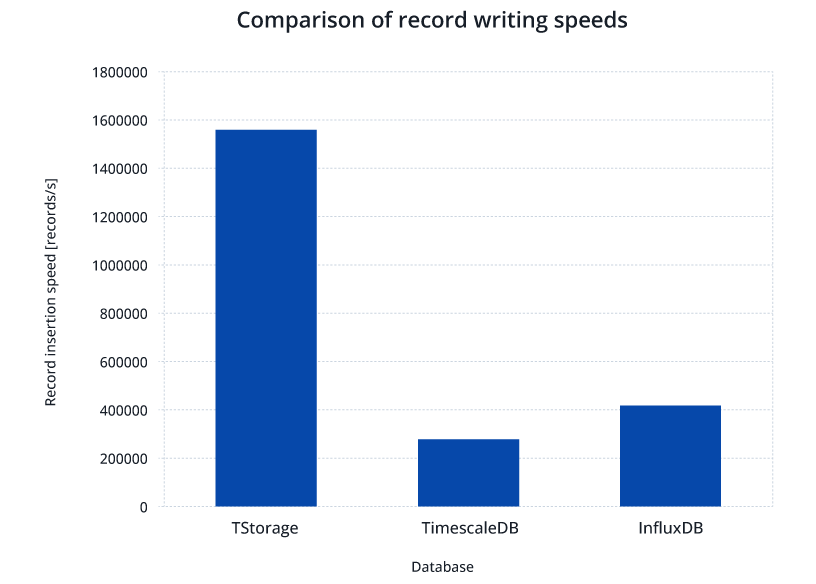
Next, we compare the obtained results. In each case, we insert 6,315,840,000 records, with each record storing 10 measurements. The metric used for comparison is the average number of records written per second.
Table 1: Results of record insertion into the selected database.
| TStorage | TimescaleDB | InfluxDB | |
|---|---|---|---|
| Record Write Speed | 1,571,104 records/s | 269,217 records/s | 414,425 records/s |
| Write Time | 67 min | 391 min | 254 min |
Data Retrieval
We prepared three test scenarios for data retrieval, each executed on a single thread. Within each scenario, we prepare 100 random queries. To improve result consistency across different data caching systems, each query is repeated, and the execution time of the second query is measured. Execution times are recorded within the scripts performing the tasks. To minimize the influence of external factors on test results, query outputs are not displayed on the screen (although each tool used provides this option to verify result consistency).
Test Scenarios
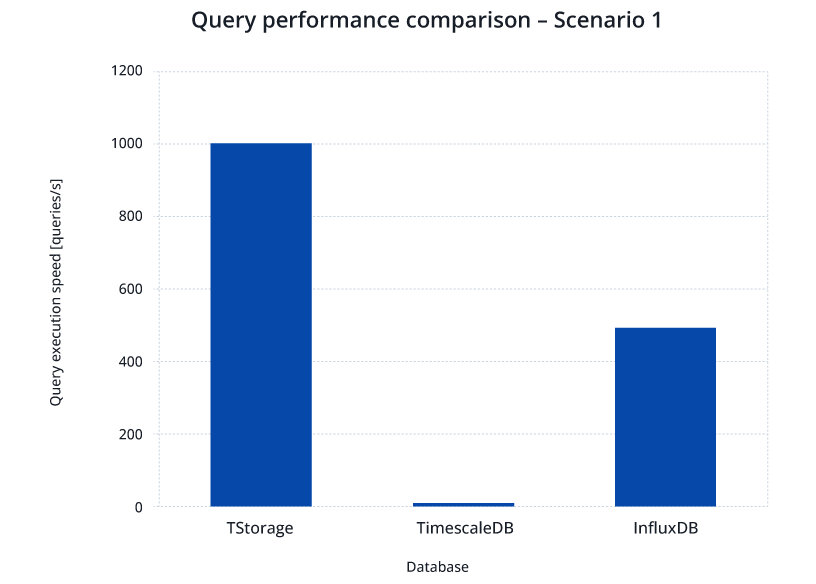
- A single query consists of randomly selecting one host, one metric, and a 12-hour time range, then retrieving all measurements within that period.*
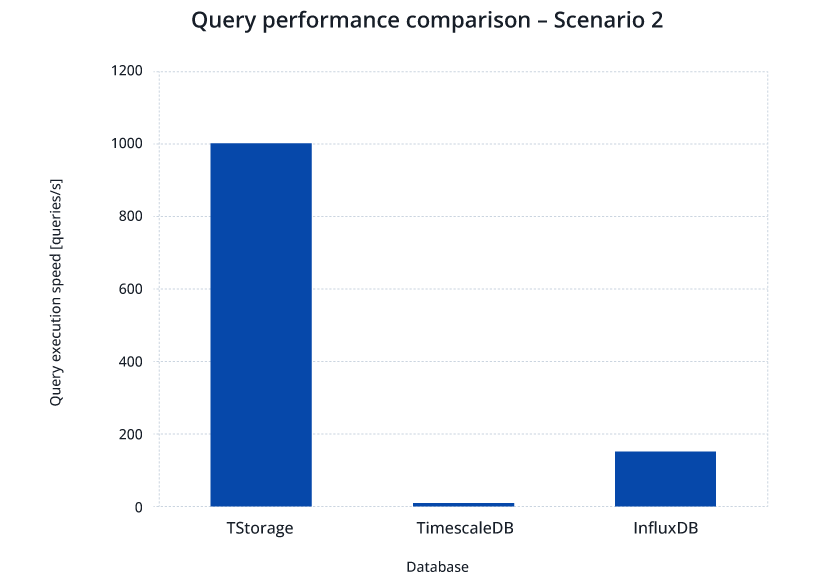
- A single query involves randomly selecting one host and a 12-hour time range, then retrieving all measurements for each metric within that period.*
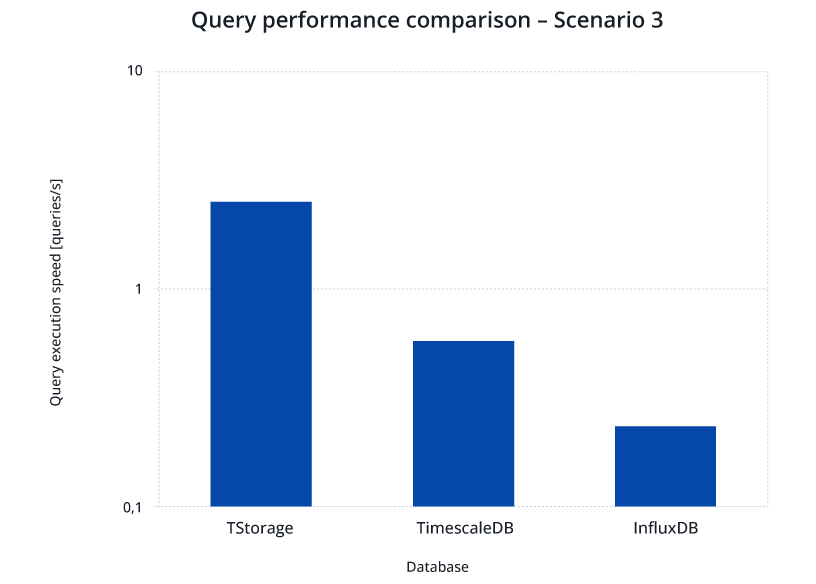
- We randomly select a 12-hour time range and one measurement value. We calculate the average measurement value for hourly intervals across all counters (separately for each counter).
* A subset of the TSBS scenarios assumes that for the retrieved counter values, the maximum value will be calculated for each interval. To simulate record retrieval without aggregation, the intervals between measurements were selected so that there is only one value in each interval.
Test Results
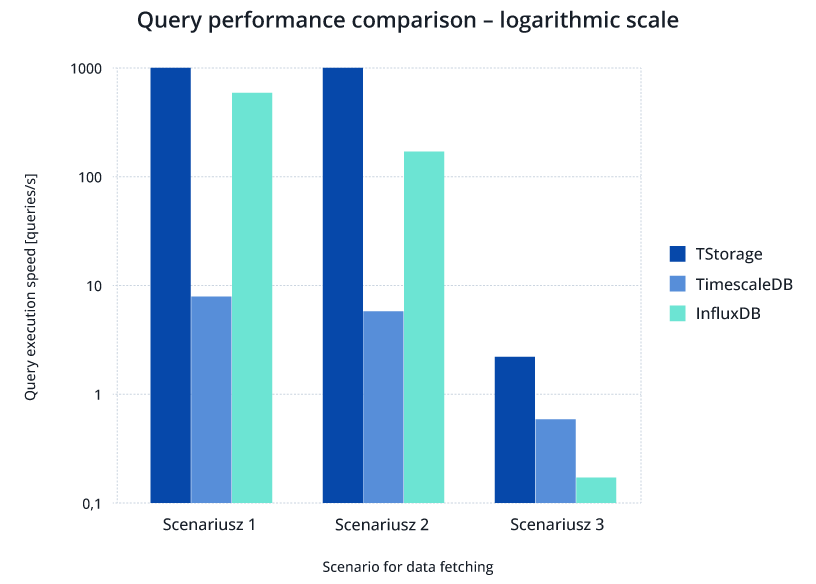
Table 2: Average execution time of test queries for individual databases.
| Scenario Number | TStorage | TimescaleDB | InfluxDB |
|---|---|---|---|
| 1 | 1ms | 135ms | 2ms |
| 2 | 1ms | 176ms | 6.5ms |
| 3 | 397ms | 2090ms | 4277ms |
Summary
In our tests, we compared the performance of three databases in terms of writing and reading records generated by a large number of counters. In both cases, we compared single-node versions writing to a single disk. The tests showed that regardless of whether the user prioritizes data writing or reading, TStorage proved to be the preferred solution for the defined workload scenarios.
